This is my third post looking at the distribution of castes in Punjab, in this case the Lohar, at the time of carrying out the 1901 Census. In 1901, the total Lohar population was 350,622, about 1.4% of the total population in undivided Punjab. The traditional occupation of the Lohar was that of a blacksmith, but among the occupational groups in Punjab, the Lohar were the most likely to be agriculturists. Unlike the Teli, who were entirely Muslim, and Julaha who were largely Muslim, the Lohar only had a small Muslim majority, around 60%, with Hindus at 32% and the Sikhs at around 8%. In fact in south east Punjab, the modern Haryana state, the Lohar were largely Hindu. The Hindu Lohars of what is now Haryana called themselves as Dhiman. Rose, the British colonial ethnologists wrote the following about the Lohar:
The Lohar of the Punjab is, as his name implies, is blacksmith pure and simple. He is one of the true village menials, receiving customary dues in the shape of a share of the produce, in return for which he makes and mends all the iron implement of agrculture, the material being found by the husbandman. He is most numerous in proportion to the total population in the hills and the Districts that lie immediately below them, where like all other artisan castes he is largely employed in field labour. He is present in singularly small numbers in the Multan division, the Derajat and Bahawalpur; probably because men of other castes engage in blacksmith’s work in those parts, or perhaps becausa the carpenter and the blacksmith are the same.
Like the Tarkhans, the Lohar were in seipi relationship with the other villagers, providing service in kind, in return for payment in wheat and other agricultural produce. Seipi refers to the barter system among Punjabi villagers, where for example a blacksmith would exchange their well sought after service for agricultural produce from farmers. This system was particularly strong in villages in central Punjab by the beginning of the 20th Century. The last census to count caste was that of 1931, when the Lohar population was 333,910, of which Muslims numbered 241,972 (73%), Hindus were 74,761 (22%) and Sikhs were 16,935 (5%).
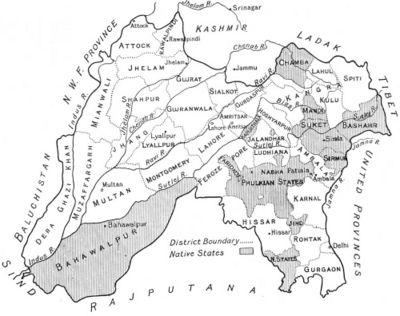
Map of Punjab 1911
In 1901, Punjab consisted of the following districts, divided into five divisions.
| Rawalpindi Division | |
| Lahore Division | |
| Multan Division | |
| Jullundur Division | |
| Delhi Division |
In 1901, about half of the Lohar population was found in the Lahore and Jalandhar divisions. The remainder were in Ambala (about 16%), Rawalpindi (about 12%), Phulkian States (about 9%) and Multan (about 4%) divisions. In terms of percentage of the total district population, they were as follows:
Lahore Division
Lahore 1.4%
Amritsar 2%
Sialkot 2%
Gurdaspur 2%
Gujranwala 2%
Montgomery 1%
In 1901, Lohar formed 2% of the total population of in most districts. The total population in the division was 96,456, of which Muslims were 76,017 (79%), Sikhs were 11,128 (12%) and Hindus were 9,311 (9%).
Jalandhar Division
Jalandhar 2%
Hoshiarpur 2%
Kangra 2%
Firozpur 1%
Ludhiana 1%
The Lahore and Jalandhar Divisions were home to half of the total Lohar population, and Lohar formed between 1 and 2 percent of the total district population in the Jalandhar Division. In the division, including Kapurthala and Faridkot State, their total population was 71,601, of which Hindus were 40,342 (56%), Muslims were 20,683 (29%) and Sikhs were 10,576 (15%).
Ambala Division
Ambala 2%
Karnal 1.5%
Rohtak 1.4%
Hisar 1%
Delhi 1%
About 16% of the total Lohar population lived in the Ambala Division, roughly modern day Haryana. They generally formed between 1 and 2 percent of the total district population. The total Lohar population was 59,647 (including the Kalsia State), of which Hindus were 32,132 (54%), Muslims were 27,017 (45%), and Sikhs were 498 (1%).
Rawalpindi Division
Rawalpindi 2%
Jhelum 2%
Gujrat 2%
Shahpur 1%
Mianwali 1%
About 12% of the total Lohar population lived in Rawalpindi, and they made between 1 and 2 percent of the total district population. The total Lohar population in the district was 51,687, of which Muslim were 51,440, Sikhs 185 and Hindus 62. Outside Rawalpindi city, the entire Lohar population was Muslim.
Phulkian States
Jind State 2%
Patiala State 1.4%
Nabha State 1%
About 9% of the total Lohar population lived in the Phulkian States, they formed between 1 and 2 percent of each states population. The total Lohar population was 30,253, of which Hindus were 12,290 (41%), Muslims were 11,771 (39%) and Sikhs were 6,192 (20%).
Evolving Identity of the Punjab Lohar
At this time, Sikh Lohars were merging with the Sikh Tarkhans to form a single Ramgarhia caste. While Muslim Lohar groups began to call themselves Mughals at around the same time. I would ask the reader to look at Khalid Nadvi’s book The Post-Colonial State and Social Transformation in India and Pakistan, about of the Lohar in Sialkot, and their role in creating the surgical instrutments industry. Sialkot had the third highest number of Lohars, and in the city made up a third of the population. However, in 1901, these trends has just begun, with most Lohar groups still registering themselves as Lohar.
| District/State | Muslim | Hindu | Sikh | Total |
| Patiala State | 8,635 | 8,493 | 5,306 | 22,434 |
| Amritsar | 16,257 | 323 | 5,550 | 22,130 |
| Sialkot | 19,253 | 1,866 | 147 | 21,266 |
| Gurdaspur | 6,860 | 6,595 | 3,295 | 16,750 |
| Lahore | 14,394 | 413 | 1,741 | 16,548 |
| Rawalpindi | 16,115 | 62 | 185 | 16,362 |
| Hoshiarpur | 2,507 | 11,476 | 1,928 | 15,911 |
| Kangra | 166 | 15,695 | 40 | 15,901 |
| Gujranwala | 15,440 | 103 | 286 | 15,829 |
| Jalandhar | 5,012 | 6,283 | 4,182 | 15,477 |
| Gujrat | 13,504 | 71 | 13,575 | |
| Karnal | 8,168 | 5,233 | 88 | 13,489 |
| Ambala | 4,547 | 8,438 | 325 | 13,310 |
| Jhelum | 10,536 | 10,536 | ||
| Firuzpur | 7,775 | 680 | 1,384 | 9,839 |
| Hisar | 7,067 | 2,709 | 47 | 9,823 |
| Ludhiana | 1,600 | 4,624 | 2,503 | 8,727 |
| Rohtak | 2,503 | 6,158 | 8,661 | |
| Chenab Colony | 7,255 | 602 | 541 | 8,398 |
| Gurgaon | 2,040 | 4,873 | 6,913 | |
| Shahpur | 6,523 | 6,523 | ||
| Delhi | 2,173 | 4,174 | 6,347 | |
| Mianwali | 4,762 | 4,762 | ||
| Jind State | 2,163 | 2,216 | 264 | 4,643 |
| Kapurthala State | 2,452 | 1,427 | 430 | 4,309 |
| Montgomery
|
3,813 | 11 | 109 | 3,933 |
| Multan | 3,678 | 39 | 57 | 3,774 |
| Mandi State
|
3,641 | 3,641 | ||
| Malerkotla State | 390 | 2,267 | 882 | 3,539 |
| Jhang | 3,535 | 3,535 | ||
| Nabha State | 973 | 1,581 | 622 | 3,176 |
| Nahan State | 85 | 1,896 | 181 | 2,162 |
| Muzaffargarh | 1,697 | 1,697 | ||
| Chamba State | 1,684 | 1,684 | ||
| Faridkot State | 1,171 | 157 | 163 | 1,491 |
| Bahawalpur State | 1,368 | 1,368 | ||
| Dera Ghazi Khan | 1,187 | 1,187 | ||
| Kalsia State | 519 | 547 | 38 | 1,104 |
| Nalargarh State | 44 | 721 | 765 | |
| Shimla
|
31 | 639 | 670 | |
| Other Districts/ States | ||||
| Total | 206,371 | 113,100 | 30,935 | 350,622 |
